Field Goal Percentage in the NBA is Broken. So I Made it Better.
The NBA has used Field Goal Percentage (FG%) as the standard of shooting efficiency for decades. However, the increasing popularity of the 3-point shot has greatly reduced the validity of this sentiment. Effective Field Goal Percentage (eFG%) and True Shooting Percentage (TS%) have emerged as the two most popular shooting stats in basketball circles because they account for the additional point from 3-point shots. Both of these modern field goal measures surpass FG%, but they still have some room for improvement. In order to remedy some of the problems with these stats, I created a revised metric that may provide a more accurate representation of scoring efficiency.
A player that only attempts 2-point shots leads the league in field goal percentage every single season. The best 3-point shooters shoot about 45% from the 3-point line, while the best centers and power forwards shoot upwards of 60% around the basket. This dynamic makes it nearly impossible for 3-point shooters to lead the league in overall FG% as the more threes they take, the closer their FG% trends away from that 60% benchmark. During the 2021 NBA season, this situation even created an odd field goal disparity between two superstar guards: Stephen Curry and Kyrie Irving. Over the course of the season, Stephen Curry shot 56.9% on 2-point attempts and 42.1% on 3-point attempts; Kyrie Irving shot 56.1% on 2-point attempts and 40.2% on 3-point attempts - both shooting splits lower than Curry’s. However, when 2-point percentages and 3-point percentages were aggregated, Kyrie Irving (50.6%) ended up with a higher FG% than Stephen Curry (48.2%).
This is a statistical anomaly known as Simpson’s Paradox. This phenomenon is when one or more groups of data show one trend, but when combined show a contradictory trend. In this case, Curry attempted many more threes than Irving, so his 42.1% 3-point percentage was weighted more than Irving’s 40.2% in the overall FG% calculation. In order to remedy this paradox, we need to apply additional context to these shooting splits.
eFG% gives a more accurate representation of efficiency by considering the extra point gained by 3-point field goals and weighing the frequencies of 2-point and 3-point shots. It also solved the paradoxical field goal percentages between Stephen Curry’s and Kyrie Irving’s 2021 season, as their eFG% were .605 and .576, respectively.
TS% is somewhat similar to eFG%, except it factors free throw shooting into its calculation. In my opinion, even though TS% is more comprehensive than eFG%, it still disproportionately rewards players that shoot a large number of free throws relative to their total shot attempts, including players that shoot well below the league average from the free throw line. Thus, I prefer using eFG% as the go-to shooting metric because of its simplicity and direct modification to the traditional FG%.
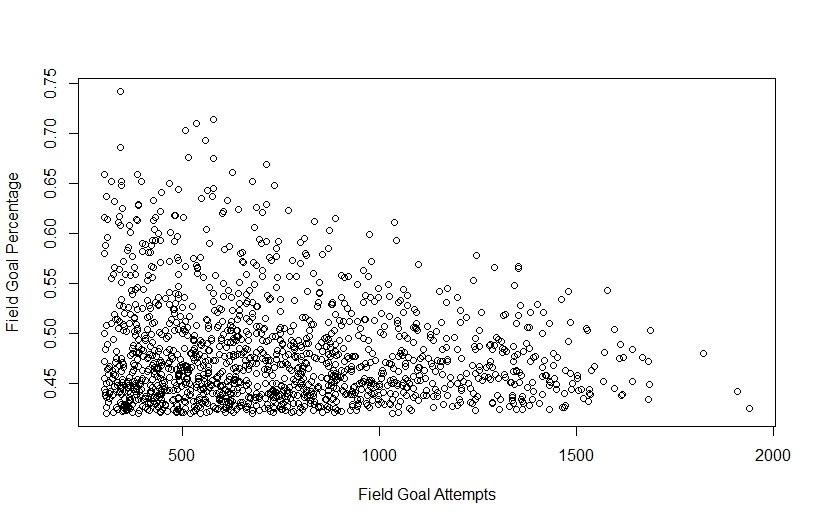
However, when I look at the leaderboards for eFG% and TS%, there is a glaring problem: players that barely make enough field goals to qualify for league leaders are disproportionately common. I believe this happens because most of the players on the top of the list simply take easy shots. For example, the league leader in eFG% this season, Rudy Gobert, takes almost exclusively layups and dunks, many of which are open and ostensibly easier than any shot that a guard or forward may take. Granted, you also have some guards and forwards that only take open jump shots or easy shots in the paint; either way, they’re not taking, or making, the same types of shots as the league’s best scorers. In the NBA, FG% trends downward as field goal attempts increase (see plot below). This suggests that maintaining a high FG% over a large number of shot attempts is unsustainable - and supports my theory that the lower volume shooters take easier shots.

In order to figure a way to recontextualize eFG%, I looked to baseball’s advanced stats. I gravitated towards OPS+, a stat that normalizes and scales one of the go-to aggregations of hitting splits. OPS+ uses league average OPS and ballpark factors in a given season to create a scale where 100 OPS+ is exactly average and 90 OPS+ is 10% less than average. The NBA doesn’t have to worry about stadium-adjusted statistics, but eFG% can still be normalized to account for league-wide field goal attempts and reward players who take more shots than the league average.


NBA.com states that in order to qualify for league leaders in FG%, a player must make 300 or more field goals. I wanted to create a scale that would justly reward high volume shooters, but at the same time not completely diminish the efficiency of frugal shooters. I wanted to find a coefficient that modifies eFG% to create an adjusted measure. I decided to call the stat Adjusted Effective Field Goal Percentage - abbreviated as aFG%. I applied the same normalization concept as OPS+ by taking an individual players field goal attempts and dividing it by the league average. Since the distribution of field goal attempts is skewed right, I applied a logarithmic scale so the players that had three or four times the average shot attempts didn’t get unfairly rewarded. I found that this formula did the trick:

This formula results in a number generally between .9 and 1.1, meaning that aFG% is at most ±10% of the original eFG%. With this method, players that are not volume shooters are penalized, but not to the point where they are completely eliminated from the leaderboards. I feel like aFG% does a much better job at illustrating offensive efficiency spanning across an entire season. The top 20 players in aFG% are obviously more notorious scorers than the top 20 eFG% and TS% leaderboards. However, I realized many players with injury-shortened seasons missed the 300 field goal cutoff and consequently did not have a chance to be represented on the leaderboards. I figured that a fair remedy to this issue was to estimate their stats across 72 games.

Top 20 with unadjusted player stats

Top 20 assuming players played all 72 games
Regardless of whether you look at the base stats or injury-adjusted stats, the most efficient scorer this season was Stephen Curry - by a respectable margin. This makes sense if you think about it: Curry led the NBA in scoring on great shooting splits. Not to mention that 2nd place on the leaderboard is Nikola Jokic, the MVP of the 2021 season.
There are more comprehensive stats such as OWS and OBPM, but aFG% is a fairly simple and palpable shooting stat. Although it’s not a holistic measure of total offensive production, aFG% is immensely better than FG% at outlining the best scorers in the NBA and adds necessary context to shooting efficiency.
If you’re interested in the data I used, check out my NBA Player Career Stat Totals by Season dataset on Kaggle.