Data Visualizations for the 2023 MLB Season
A few nights ago, the 2023 MLB season officially concluded with the Texas Rangers winning their first-ever World Series after defeating the Arizona Diamondbacks. Admittedly, I didn’t consistently start watching baseball until the postseason started, but I quickly acquainted myself with some of the most interesting stats and trends of the season to understand the narratives discussed in the playoff broadcasts. Similar to what I did with the 2023 NBA season, I want to use data to showcase this consequential and eventful MLB season.
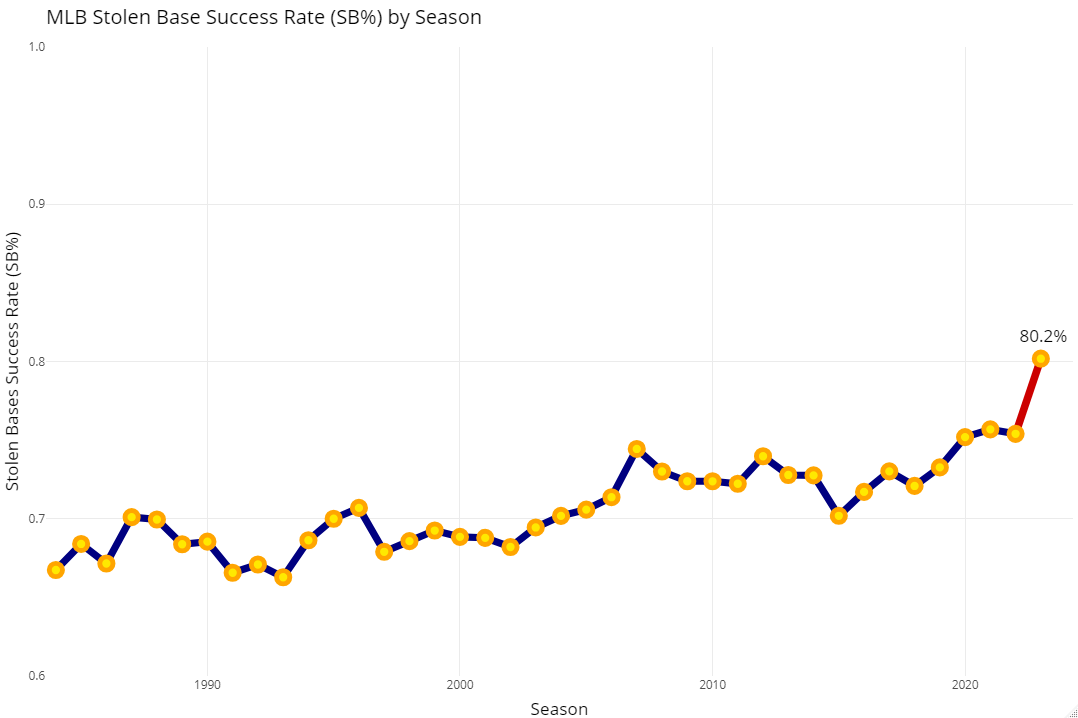
The Rule Changes Make a Drastic Difference
The MLB introduced several rule changes going into the 2023 season in hopes of making the game more engaging. The addition of the pitch clock, pickoff limits, and defensive shift restrictions directly influenced how the sport was played: the average time of games was the lowest since 1984 and the league saw the highest stolen base numbers ever. The rule changes initially faced some resistance, but the action-packed games convinced players and fans alike that the new rules were improving the sport.


Atlanta Braves Set Multiple Team Batting Records
Led by Matt Olsen and Ronald Acuña Jr., the Atlanta Braves had one of the best offenses ever. Either Acuna or Olsen led the National League in almost every batting stat this season, and the rest of the Braves had impressive contributions as well. The team hit 307 home runs, tying the 2019 Minnesota Twins for the most by a team in a single season, and also posted the highest team slugging percentage of all time. Of course, having the highest home run total of all time will contribute to a high slugging percentage, but the Braves also had the highest batting average of any team this season with plenty of doubles to boot.


The Astros Don’t Play Well in Houston
The Houston Astros have developed the undesirable reputation of being one of the worst home teams in the MLB. Despite boasting some of the best batting lineups and rotations in the league, the Astros had a measly 39-42 home record, the worst ever by a team that ended up winning their division. The struggles at home followed them into the postseason, where they went 1-5 at Minute Maid Park, including losing all four of their home games in the ALCS to the Texas Rangers. The 2023 Astros became the second team in MLB history to lose four home games in a single series - the first team to do so was the same Astros core in the 2019 World Series.
An Insane Postseason
To the Astros' credit, most teams struggled at home this postseason. Postseason teams went 15-26 (.366) at home, by far the worst since the MLB added the Division Series to the playoff format in 1995. This terrible home record can be attributed, in part, to the unprecedented success of the Texas Rangers: they went 11-0 in their road games during their playoff run. During their improbable run, Adolis Garcia set a record for the most RBI in a single postseason despite missing the Rangers’ final two games due to an oblique injury.


Most didn’t even expect the Rangers to make the World Series, or even the Diamondbacks for that matter. Both were wildcard teams that were underdogs in every series on their way to the championship. In fact, these two teams had the lowest combined regular season wins (174) of any World Series matchup since the MLB introduced the 162-game schedule in 1961.
The extensive record-keeping and granularity of MLB data provides limitless possibilities to find interesting trends - as well as arbitrary records and first-time occurrences, so I tried to discuss the most meaningful and fun stats and oddities of the season. I didn’t delve into the fancier stats like wRC+ (which the Braves offense had the third highest of all-time at 125) or any of the Statcast numbers, but if I get invested in the MLB in 2024, they may open a whole new world of creative and captivating data visualizations.