Python Random Variable Calculator
Random variables and probability distributions are some of the most fundamental concepts in statistics. While working on my undergraduate coursework, I encountered countless questions that asked about the properties of random variables, including how they were affected by linear transformations. Most of the time, the calculations were fairly straightforward, but sometimes they could seem unexpectedly complex, especially without adequate practice. Since I still often work with random variables and probability distributions, I made a random variable calculator in Python to facilitate my workflow.
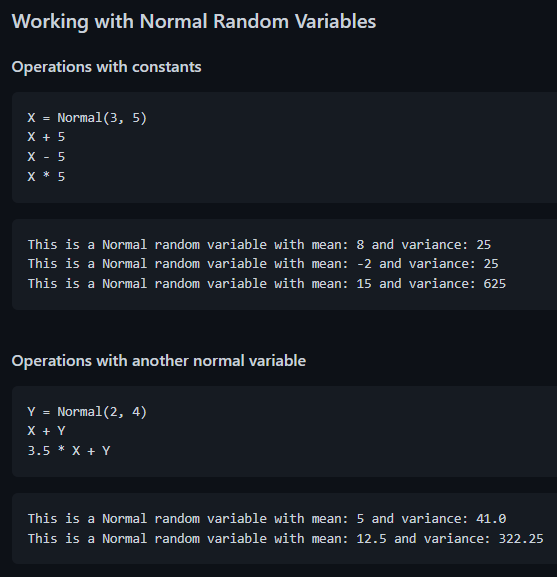
Demo of the calculator. See full project at github.com/ross-wgh/RandomVariable
A probability distribution is a function that defines the probability of occurrence of the different possible outcomes of a random variable. Every probability distribution has an expected value (also known as the mean) and a variance, which are determined by the parameters of the distribution. For example, a normal distribution has two parameters, μ and σ, which directly define the expected value and the square root of the variance, respectively.
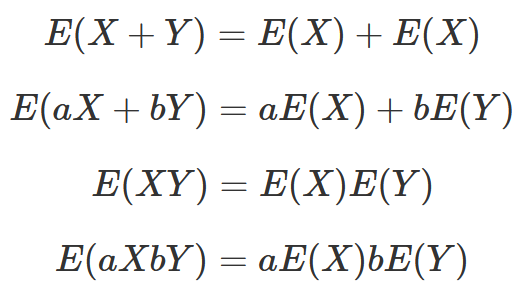
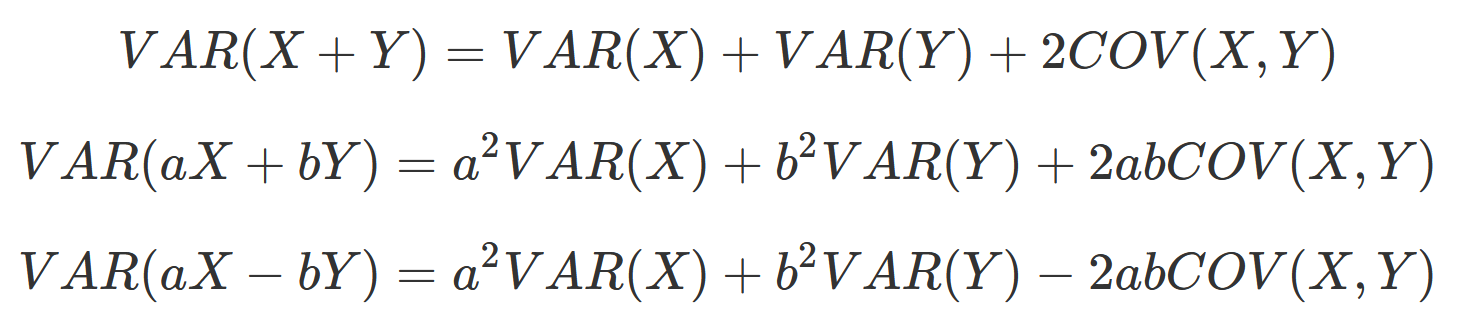
Working with a single random variable is relatively easy, but what happens when you want to create a linear combination of multiple random variables? First, you need to know the mathematics of expectations and variances. Some statistics courses spend multiple weeks working on these concepts, but the following formulas can get you 90% there.
Expectation:
Variance:
These equations can get slightly more complex if the variables are dependent or if you have a linear combination of three or more variables, but that’s why I coded a calculator to handle those more difficult problems.
The Code
My calculator uses an object-oriented programming approach to handle the interactions between several types of distributions. It also utilizes Python’s magic methods to help the Python interpreter understand how to perform mathematical operations on the random variables.
One of the most challenging parts of this project was brainstorming ways to seamlessly perform operations on different distributions. For example, a normal random variable plus a normal random variable yields a normal random variable, but a normal random variable plus a uniform random variable does not follow a parameterized distribution. To solve this problem, I opted to use RandomVariable as a generic base class, and each specified distribution as a subclass. With this setup, the distributions can have specific behaviors defined within their class if necessary, but can still use the generalized methods from the RandomVariable class. I highly encourage you to try out the calculator for yourself: it is currently available on my GitHub.
Creating this calculator gave me a great opportunity to think critically about key ideas of software design, as well as to brush up on my statistics skills. I’ve been busy working on my Data Science Master’s coursework, but I always love when I get the chance to apply and share what I’ve been learning about.